Why Traders Love the Parallel Channels Chart Pattern?
Because it’s straightforward! A parallel channel chart pattern helps traders visualize the market rhythm — when prices swing between predictable highs and lows. It’s like watching waves move in a steady direction, helping you decide when to ride the wave and when to step back.
Structure of a Parallel Channel Chart Pattern
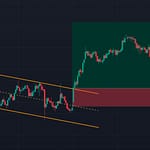
A Parallel Channel chart pattern is made up of three key parts:
- Upper Trendline (Resistance): The top line connecting swing highs.
- Lower Trendline (Support): The bottom line connecting swing lows.
- Channel Width: The distance between the two lines, showing volatility.
- Middle Line: If the market respects the midline, the channel is more reliable. In fact, traders should wait until the midline is properly respected.
When the price stays between these two lines with the middle lines respect, traders consider the trend and channel valid.