If you are new to trading and want to better understand price action, the Parallel Channel chart pattern is a great place to start. It’s simple, visual, and highly effective for identifying potential trading opportunities. Traders use it to identify both trends and reversals – making it a must-know concept for technical analysis enthusiasts.
Table of Contents
ToggleWhat is a Parallel Channel Chart Pattern?
A Parallel Channel is a price pattern formed when the market moves between two parallel lines — one acting as resistance and the other as support. It represents a consistent uptrend, downtrend, or sideways movement, depending on the direction of the lines.
[articlepage]
Why Traders Love the Parallel Channels Chart Pattern?
Because it’s straightforward! A parallel channel chart pattern helps traders visualize the market rhythm — when prices swing between predictable highs and lows. It’s like watching waves move in a steady direction, helping you decide when to ride the wave and when to step back.
Structure of a Parallel Channel Chart Pattern
A Parallel Channel chart pattern is made up of three key parts:
- Upper Trendline (Resistance): The top line connecting swing highs.
- Lower Trendline (Support): The bottom line connecting swing lows.
- Channel Width: The distance between the two lines, showing volatility.
- Middle Line: If the market respects the midline, the channel is more reliable. In fact, traders should wait until the midline is properly respected.
When the price stays between these two lines with the middle lines respect, traders consider the trend and channel valid.
[articlepage]
Types of Parallel Channels Chart Pattern
1. Ascending Channel
- Formed when both lines slope upward.
- Indicates a bullish trend with higher highs and higher lows.
- Best for selling opportunities near the higher trendline and resistance area.
2. Descending Channel
- Both lines slope downward.
- Represents a bearish trend with lower highs and lower lows.
- Ideal for buying near the lower trendline and support area.
3. Horizontal Channel
- Lines move sideways.
- Reflects a range-bound market, where the price oscillates between support and resistance.
[articlepage]
How to Draw a Parallel Channel Correctly
- Identify at least two higher lows or two lower highs.
- Draw the first trendline connecting these points.
- Create a parallel line on the opposite side of the price movement.
- Ensure both lines are equidistant and parallel.
Pro Tip: Use tools like “Parallel Channel” in TradingView or similar charting software for precision.
[articlepage]
Common Mistakes While Drawing a Parallel Channel Chart Pattern
- Forcing lines to fit the price.
- Ignoring minor wicks or shadows.
- Drawing based on closing prices only.
Remember, a valid channel should touch at least two points (Most Important) on both upper and lower lines.
How to Identify a Valid Parallel Channel Chart Pattern
A valid channel must have:
- At least two touches on both trendlines.
- A consistent slope (upward, downward, or flat).
- Smooth, flowing price movement within boundaries.
- Also, respect for the middle line.
If prices repeatedly respect the channel lines, it’s a strong and tradable pattern.
[articlepage]
Trading the Ascending Channel
- Entry: In the ascending channel, look for a down-site opportunity only. Never use an ascending channel for an up-site opportunity. It is against the chart nature. Take entry on the confluence of resistance and the upper line of the channel.
- Stop-Loss: Above the resistance.
- Take Profit: Near the middle line of the channel or the next support or according chart structure.
When a breakdown occurs below the support, it signals strong bearish momentum — a chance for breakout traders to enter.
[articlepage]
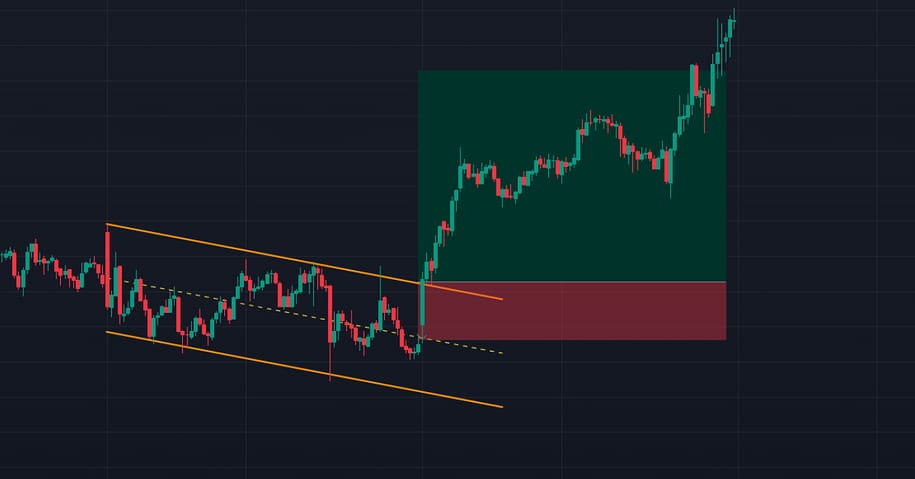
Trading the Descending Channel
- Entry: In the descending channel, look for upper site opportunity only. Never use a descending channel for a down-site opportunity. Its against the chart nature. Take entry on support and confluence of the lower line of the channel.
- Stop-Loss: Just below support.
- Take Profit: Near the middle line of the channel or the next resistance or according to chart structure.
If the price breakout above resistance , it indicates stronger bullish sentiment — a chance for breakout traders to enter.
[articlepage]
Breakouts and Fakeouts
Not every breakout is real. Sometimes, prices just poke out and return, known as a fakeout.
To avoid fakeouts:
- Confirm with the chart nature.
- Wait for the candle to close outside the channel. If the close is moving away, wait for a retest.
- Also, wait for additional price action confirmations.
You May Like to Read: Best Strategy To Trade an Order Block In Trading
Parallel Channel Chart Pattern vs. Trendline Trading
While trendlines show one side of price movement, channels give a complete range — support and resistance. That’s why channels offer better entry and exit clarity.
[articlepage]
Psychology Behind the Parallel Channel Chart Pattern
Channels represent the market’s natural rhythm — a tug of war between buyers and sellers. Each bounce reflects traders reacting to these invisible boundaries. Understanding this behavior helps you trade with the crowd, not against it.
Pro Tips for Parallel Channel Chart Pattern Trading
- Always wait for two confirmed touches before drawing a channel.
- Stick to higher timeframes for reliability.
- Use alerts for potential breakout levels.
- Maintain a risk-to-reward ratio of at least 1:2.
Common Mistakes to Avoid
Chasing every move inside the channel.
Ignoring breakout confirmations.
Forgetting to adjust channels when trends shift.
Remember: Patience is key — let the market show you its rhythm.
[articlepage]
Conclusion
The Parallel Channel Pattern is one of the most powerful and beginner-friendly tools in technical analysis. It teaches you to trade with structure, discipline, and clarity. Whether the market is trending or ranging, channels provide traders with a clear visual representation of price boundaries and potential opportunities.
Master this pattern, practice identifying it, and you’ll soon develop the trader’s eye to catch profitable setups with confidence.
[articlepage]
FAQs
1. What is a Parallel Channel in trading?
A Parallel Channel is a chart pattern formed by two parallel lines that act as support and resistance, showing the direction of a trend.
2. Is the channel pattern good for beginners?
Yes, it’s simple, visual, and perfect for understanding price action and trend movements.
3. Which timeframe is best for channel trading?
Higher timeframes, such as 1-hour, 4-hour, or daily charts, provide more reliable results. But a trader can trade it in any time frame as their comfort.