If you are new to trading and want to better understand price action, the Parallel Channel chart pattern is a great place to start. It’s simple, visual, and highly effective for identifying potential trading opportunities. Traders use it to identify both trends and reversals – making it a must-know concept for technical analysis enthusiasts.
What is a Parallel Channel Chart Pattern?
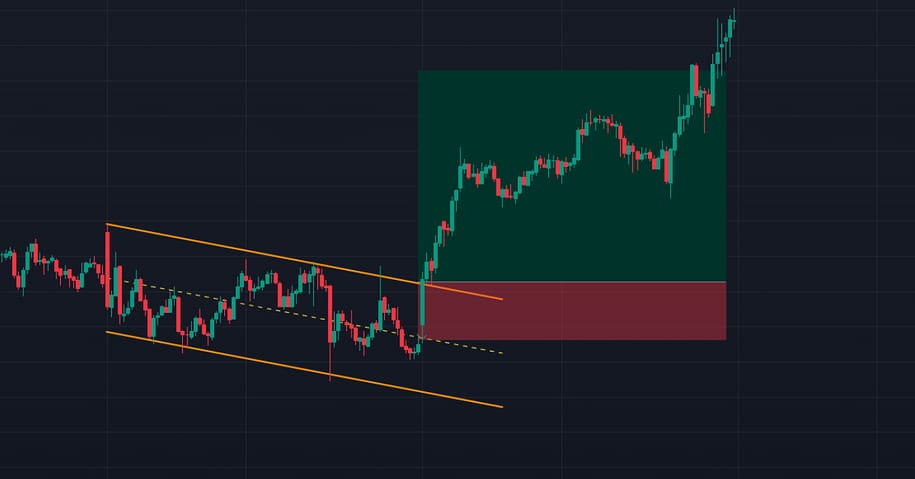
A Parallel Channel is a price pattern formed when the market moves between two parallel lines — one acting as resistance and the other as support. It represents a consistent uptrend, downtrend, or sideways movement, depending on the direction of the lines.