When you dive into the world of options, stock or cryptocurrency trading, one of the most important skills to master is the ability to recognize chart patterns. These patterns can give you insight into market trends, helping you make more informed decisions.
One such popular pattern that traders often look for is the cup and handle pattern. In this blog post, we will explain what a cup and handle pattern is, how to recognize it on a trading chart, and how you can trade using this pattern in simple terms.
Table of Contents
ToggleWhat is the cup and handle pattern?
A cup and handle pattern is a chart formation that looks like a teacup with a handle. This pattern is a bullish or bearish continuation pattern, which means that it usually indicates that the market’s uptrend or downtrend is likely to continue. Here is a step-by-step explanation of what the pattern looks like:
Cup:
The cup portion of the pattern resembles a “U” shape. It forms when an asset’s price drops (forms the left side of the cup), stabilizes (forms the bottom of the cup), and then rises again (forms the right side of the cup).
Handle:
After the cup is formed, prices usually move sideways or down slightly for a short period of time, creating a small consolidation zone that looks like a handle on the cup. This handle usually slopes down slightly but should not fall too far or too fast.
Breakout:
The final stage of the pattern is the breakout, where the price breaks out of the handle and continues to rise, often with increased volume.
Under certain conditions, cup and handle patterns take weeks to months to develop and in intraday or day trading it develop in minutes. When cup and handle pattern forms on support then possibility of upside moment is high and in case of resistance its vice versa. Support and resistance levels play very important role in successful cup and handle pattern trading.
How to recognize a cup and handle pattern?
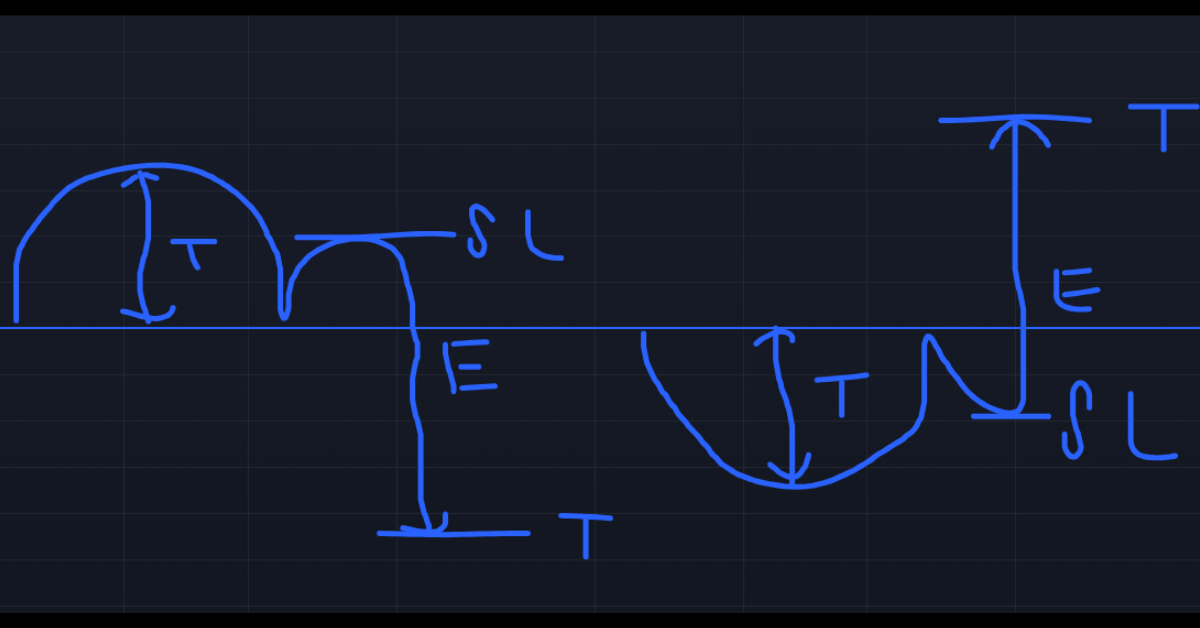
Identifying cup and handle patterns on a trading chart requires patience and attention to detail. Here’s how you can find it:
- Look for an uptrend: The pattern usually appears during an existing uptrend. This means the price has been moving upwards for some time before a pattern is formed.
- Recognize the “U” shape of the cup: The cup should have a rounded bottom that resembles the shape of the letter “U”. A “V” shaped bottom is less ideal, as it indicates that the price may be very volatile.
- Check the depth of the cup: The depth of the cup should be medium. If the cup is too deep, it may show a strong correction rather than a continuous pattern. Typically, the drop from the peak to the bottom of the cup is about 10-30%.
- Identify the handle: After the cup is formed, a small pullback occurs, forming the handle. The handle should not dip more than 15% from the top of the cup. If the handle is too deep, it may invalidate the pattern.
- Wait for the breakout: The most important part of the pattern is the breakout. This happens when the price moves above the resistance level formed at the top of the cup. A breakout trading volume needs to increase to confirm the pattern.
Steps to trade cup and handle pattern
Once you have identified the cup and handle pattern on the chart, the next step is to trade it. Here is a simple guide to help you do this:
Access Point:
The ideal entry point is when the price breaks above the resistance level (top of the cup). You can set a buy order slightly above this level to ensure a breakout.
Some traders may choose to enter a trade as soon as a handle is formed in anticipation of a breakout. It is risky but can give good returns in case of breakout.
Setting Stop-Loss:
To manage risk, place a stop-loss order below the lowest point of the handle. This ensures that your losses are minimized if the trade does not go as planned and the price falls.
If you enter a trade after a breakout, place the stop-loss slightly below the breakout point or handle.
Target Price:
A common target price is determined by measuring the distance from the bottom of the cup to the neck line level. Add this distance from neck line to the breakout direction to set your target.
For example, if the depth of the cup (top to bottom) is 20 points then target will be 20 points from neck line.
Volume Confirmation:
Make sure there is a breakout with a significant increase in trading volume. High volume confirms that there is strong market interest in the move, reducing the likelihood of a false breakout.
Trailing Stop Loss:
As price moves in your favor, consider using a trailing stop-loss to lock in profits. A trailing stop loss automatically adjusts as the price rises, allowing you to take profits while protecting your capital.
12 Important Rules to Trade Cup and Handle Pattern successfully
1) Mark swings and necklines in live market to identify cup and handle pattern easily.
2) Wait for proper formation of pattern don’t rush.
3) Risk reward ratio must be more than 1:2 minimum compulsory.
4)Take entry only after breakout or breakdown of neck line.
5) If closing is away from neck line then wait for retesting otherwise avoid entry.
6) First target must be depth of cup.
7) Stoploss must be height of handle.
8) If price reverse from 70-80% of your target or shown any opposite sign then stoploss must be on cost.
9) If price stuck for more than 45-60 minutes then exit trade at market price. This is known as 45-60 rule.
10) Never take trade to look profit only also look for risk.
11) Before taking trade always look for obstacles before target.
12) When market show any opposite sign or pattern at same time of cup and handle avoid trade.
You may also like to read – 5 Key Techniques for Profitable Price Action Trading
Tips for Trading Cup and Handle Pattern
- Patience is key: Cup and handle patterns take time to form. Don’t rush into a trade before the pattern is fully developed.
- Practice on a demo account: Before risking real money, practice recognizing and trading cup and handle patterns on a demo account. This will help you gain confidence and experience.
- Watch out for false breakouts: Not all breakouts lead to successful trades. Sometimes, the price will break out but quickly reverse. This is why it is important to confirm breakouts with increased volume.
- Combine with other indicators: To increase the credibility of your trades, combine cup and handle patterns with other technical indicators such as moving averages, RSI (Relative Strength Index), or MACD (Moving Average Convergence Divergence).
- Be Aware of Market Conditions: The effectiveness of cup and handle patterns can influence overall market conditions. During bear markets or high volatility, this pattern may not work as expected.
Examples of cup and handle pattern
Let’s look at two examples to see how the cup and handle pattern works in real trading situations.
Index Trading Example:
Imagine that a index is in an uptrend, reaching a level of 100 points before pulling back to level of 70 points. The index then slowly rises to level 100 and forms a “U” shape (cup). The index then rallied slightly, falling to level of 95 (handle) before rising above level 100 on increased volume. A trader can enter a long position at level 101, set a stop-loss at level 90, and target a price (based on the depth of the cup) at level 130.
Cryptocurrency Trading Example:
Let’s say a cryptocurrency is trading at $50 and rises to $80 before falling to $60. It then climbs to $80 and forms a cup. The price consolidates around $75 (creating a handle) before moving above $80. A trader can buy at $81, set a stop-loss at $74, and set a price target of $100.
Conclusion
The cup and handle pattern is a powerful tool in the trader’s arsenal, giving a clear indication that an uptrend or downtrend is likely to continue. However, as with all trading strategies, it is important to combine it with other tools and indicators to increase your chances of success.
By patiently waiting for the pattern to fully develop and confirming the breakout with volume, you can make more informed trading decisions and potentially increase your profits.
Remember, no trading strategy is foolproof and it is important to manage your risk with stop-loss orders and proper position sizing. Whether you’re trading stocks, forex, or cryptocurrencies, cup and handle patterns can be a valuable addition to your trading toolkit. So, keep an eye out for this pattern in your charts and happy trading!


