The double bottom W pattern is one of the most popular and reliable trading pattern of technical analysis in share market. Traders use it to detect potential trend reversals, typically from bearish to bullish markets.
The pattern itself is relatively easy to identify and, if properly understood, can become a valuable tool in your trading strategy.
This post will walk you through everything you need to know about trading double-bottom patterns on trading charts.
Also, in this blog post, we will discuss the most advanced method of trading double bottom W pattern on the trading chart. This is an advanced method of earlier double-bottom pattern (Entry after breakout of neckline) trading.
In the traditional double-bottom W pattern trading method traders take entry after a break out of the neckline. However, in the advanced method, traders can take entry at the second bottom and book the first target at the neckline, where other traders take entry. This method puts traders one step ahead of fellow traders, which is the most important thing to earn profits in trading.
So, if traders use this method with chart reading, Overall chart structure, chart nature and follow all rules then this method helps them in a profitable trading journey.
Table of Contents
ToggleWhat is a Double Bottom W Pattern?
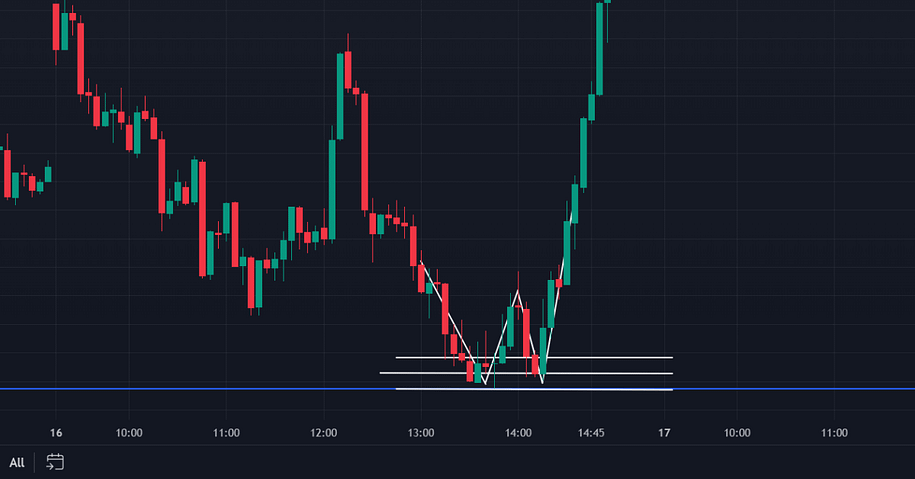
A double bottom is a bullish reversal pattern, indicating the possibility of a price decline following a downtrend. This pattern is formed after a sustained downtrend or one-sided down move which is also known as a power move(Parabolic move). Where the price peaks, returns from a certain level, drops again to roughly the same peak and then rises again.
Key Features of Double Bottom:
- Two peaks: Price makes two lows (peaks) at approximately the same level.
- Valley between Peaks: Price rises between two peaks, forming a “valley”.
- Neckline: The highest point between the two peaks is called the neckline, which acts as a resistance level. In the earlier double-bottom pattern trading method, when the price breaks above this level, it confirms the double-bottom pattern.
How to Recognize Double Bottom W Pattern?
To trade the double bottom pattern effectively, you must first be able to spot it on the chart. Here’s a step-by-step guide to identifying them:
- Find a downtrend: A double-bottom pattern follows a downtrend or one-sided down move (Power Move), so the price should be in a downtrend before the pattern is formed.
- Find the bottom first: Price will reach a low and then pull back, generally from strong support. This first peak marks the beginning of the pattern.
- Identify the pullback: After the first peak, the price should turn lower again. This pullback should not be too deep; It usually returns to the resistance level (neckline).
- Watch for the second peak: The price will drop again to roughly the same level as the first peak. However, the second peak often struggles to break the first peak, weakening the downward momentum.
- Look for an entry in three magic lines: After the formation of the neckline (before the formation of the second peak), draw the three magic lines as given, I) The First line must be low of the first peak. II) The Second line must be the multiplication of the first peak low value and 0.001 with the addition of the multiplicated value and first peak high value. III) The third line is the exact middle line of the first and second lines.
Example,
If you are in the Nifty 50 Index, the first peak level value is 24878.90. The three lines are as follows,
24878.90X0.001= 24.878,
First line – 24878.90
Second line – 24878.90+24.878=24903.778
Third line – Exact middle line of the above two lines.
A step-by-step guide to trade the double bottom W pattern with an advanced method
Now that you know how to recognize a double bottom W pattern, let’s see how you can trade it successfully.
Step 1: Wait for the sample to be fully prepared
The most important rule for trading a double-bottom W pattern is to wait for the pattern to fully form. This means the price must reach the middle line in the second bottom.
There are two methods for entry here as follows,
1) Aggressive Entry – When a trader takes an entry without closing of the green candle in the entry zone(Three lines) then it is an aggressive entry. Most of the time traders take this type of entry with limit order.
2) Confirm Entry – When traders take entry after the closing of the green candle in the entry zone then it is known as confirm entry. This is a more secure trade than aggressive entry. But in aggressive entry, SL is very low and the risk-reward ratio is better than confirmed entry.
Step 2: Set the stop-loss
Stop loss is the most important phenomenon in trading. No one is 100% right in the market. So traders have to set stop loss after entry or with a limit order while taking entry. Which saves traders from big losses. Especially in this type of double-bottom stop loss not more than low of the first peak.
Step 3: Determine your profit target
Book your first target at neck line, where other traders take entry. After that reduce your stop loss and trail your trade. Trailing stop loss is best method to ride big profits. Book the remaining quantity as per market structure or as per resistance levels.
Mandatory rules to trade double-bottom W pattern successfully
1) One-sided or power move(Parabolic move) towards a strong support level.
2) A good neckline is required.
3)Draw three magic lines as per the calculation given above.
4)Take entry in the entry zone only. The entry zone is an area of three lines, i)High line, ii)Middle line, iii)0.001 line (It is for nifty or bank nifty. For stocks or other indexes this value may be different.)
5) Entry after the price breaks the middle line without closing the green candle in the entry zone, then it is an aggressive entry.
6) Entry after closing of a green candle in the entry zone, then it is confirmed entry. In case of confirmed entry if the price breaks the previous or first peak bottom level then avoid this W pattern.
7) Avoid reentry always, If the price hits your SL then strongly avoid reentry. The market may be trapped here. So avoid setup in this type of situation.
8) A risk-reward ratio minimum of 1:2 is required, if not then avoid setup compulsory.
You may like to read: How to Trade Cup and Handle Pattern on Trading Chart
Common mistakes to avoid when trading double bottom W pattern
Trading double bottoms can be very profitable, but there are several common mistakes that traders make. Here are some things to avoid:
Getting in too early
One of the most common mistakes traders make is entering in a trade too early before the price enters in entry zone. This mistake is the reason for the big stop loss. And main reason of this mistake is traders imagine pattern in mind before it appears on chart. So avoid it strictly.
Not using stop-loss
Always use a stop loss when trading a double-bottom pattern. Without a stop loss, you expose yourself to significant risk if the market moves against you. Set your stop loss at the peak of the first bottom low to protect your trade. And it is very small compared to the profit.
Not considering a broad view
Always zoom in and zoom out the chart before trading the double bottom pattern. Sometimes in bigger picture chart gives a different message, and traders have to understand it.
Ignoring chart nature
While trading any setup or pattern traders have to consider chart nature. Sometimes after making the perfect setup or pattern market goes against the trader and hits their stop loss. It happens due to chart nature. The market always tries to fulfill its nature which is, it travels in a zigzag. So consider it carefully.
Poor chart reading skills
Chart reading is the most important part of a successful trading journey. A chart tells you everything about the market. If anyone learns chart reading skills then no need for any other things. Chart reading is supreme. Everything is included in chart reading Setups, patterns, chart nature, support resistance. So traders have to perfect this skill.
Setting unrealistic goals
Be realistic when setting your profit goals. While the double bottom pattern gives you a good indication of possible price movements, the market does not always follow predictable patterns. Make sure your profit target is achievable and consider using trailing stop losses to lock in profits when the price moves in your favor.
Conclusion
The double bottom W pattern is a reliable tool for identifying trend reversals and making profitable trades. By learning to spot patterns, confirming them with calculations, and using proper risk management, you can increase your trading success rate. Always wait for the aggressive or confirmed entry before entering a trade and set a realistic target with a stop loss to protect your capital.
By following these steps, you can confidently trade double-bottom patterns and increase your chances of profiting from market trend reversals. Happy trading!


