Role of Support Resistance Levels in Profitable Options Trading

Role of Support Resistance Levels in Profitable Options Trading

Support and resistance levels are critical concepts in options trading, serving as key markers on price charts that help traders understand market dynamics. 

Support levels represent price levels where an asset has historically found buying interest, preventing it from falling further. Think of support as a floor that keeps the price from dropping lower. When the price approaches a support level, there tends to be increased demand for the asset, causing buyers to step in and support the price.

On the other hand, resistance levels are price levels where an asset has historically encountered selling pressure, preventing it from rising further. Resistance acts like a ceiling that prevents the price from moving higher. When the price approaches a resistance level, there tends to be an increased supply of the asset, causing sellers to step in and resist further price increases.

The significance of support and resistance levels lies in their ability to provide valuable insights into market sentiment and price action. Traders closely monitor these levels to gauge the strength of buying and selling forces in the market. 

Support and resistance levels help traders identify optimal entry and exit points for their options trades. When the price approaches a support level, traders might consider buying options or entering bullish positions, anticipating a potential price bounce. Conversely, when the price nears a resistance level, traders might consider selling options or entering bearish positions, anticipating a potential price reversal.

Understanding support and resistance levels is essential for effective risk management. By placing stop-loss orders or setting profit targets near these levels, traders can mitigate risk and protect their capital. Support and resistance levels serve as reference points for defining risk-reward ratios and determining the validity of trading setups.

Successful options trading often involves crafting strategies that capitalize on market inefficiencies and price patterns. Support and resistance levels play a crucial role in shaping these strategies. Traders can develop bounce trading strategies, breakout trading strategies, or trend reversal strategies based on how price interacts with these levels.

In this blog post, we understand the role of support and resistance levels to empower options traders to make informed decisions, manage risk effectively, and execute profitable trading strategies in dynamic financial markets.

Table of Contents

Understanding Support Resistance Levels

Explanation of Support Levels:

1. Definition and Characteristics:

Support levels in trading are like sturdy floors under a bouncing ball. They represent price points where the demand for an asset is strong enough to stop its price from falling further. Think of it as a level where buyers are willing to step in and purchase the asset, preventing it from dropping lower. When the price reaches a support level, it tends to bounce back up.

2. How Support Levels are Formed:

Support levels are formed due to various reasons. They could be psychological levels where traders believe the price is cheap and worth buying. They could also be based on fundamental factors like earnings reports or economic data that attract buyers. Additionally, technical factors such as moving averages or trendlines can also act as support levels.

3. Identifying Support Levels on Price Charts:

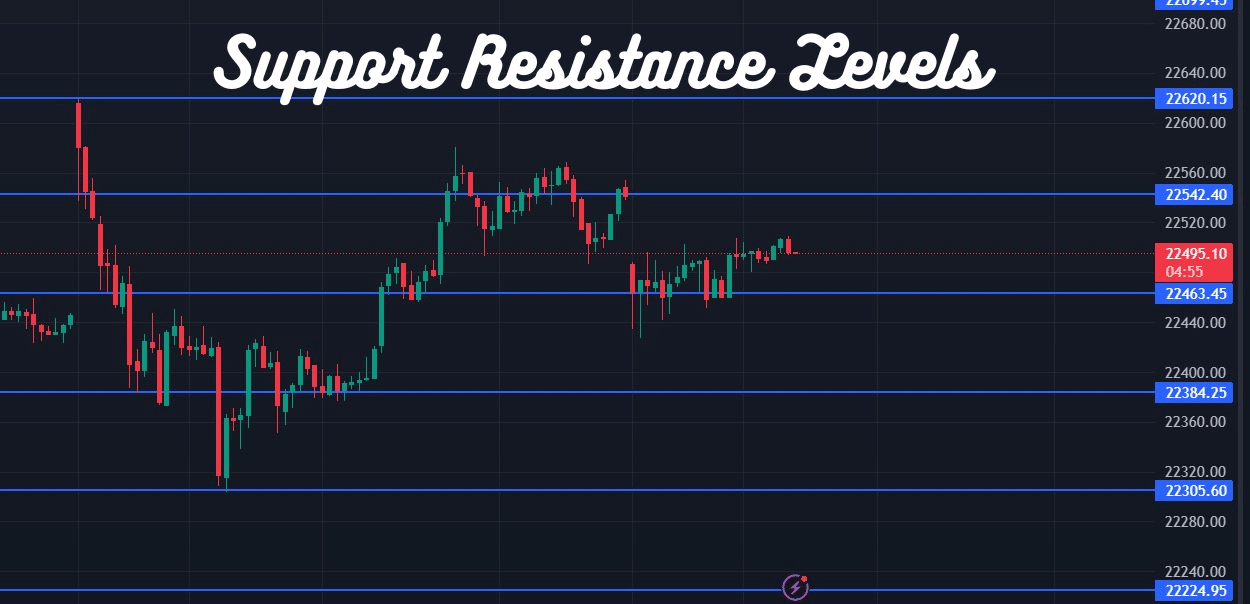
Traders identify support levels by looking at price charts. Support levels are typically seen as horizontal lines where the price has bounced multiple times in the past. These lines indicate areas where buying interest has historically been strong. Common tools for identifying support levels include drawing trendlines connecting the lows of price movements or using indicators like the Relative Strength Index (RSI) to confirm support levels.

Explanation of Resistance Levels:

1. Definition and Characteristics:

Resistance levels are like strong ceilings above a rising balloon. They represent price points where the supply of an asset is strong enough to prevent its price from rising further. Resistance levels act as barriers where sellers are willing to sell the asset, preventing it from moving higher. When the price reaches a resistance level, it tends to reverse direction and move downwards.

2. How Resistance Levels are Formed:

Resistance levels are formed for various reasons. They could be psychological levels where traders believe the price is expensive and worth selling. They could also be based on fundamental factors like company announcements or economic events that create selling pressure. Additionally, technical factors such as previous highs or Fibonacci retracement levels can also act as resistance levels.

3. Identifying Resistance Levels on Price Charts:

Similar to support levels, traders identify resistance levels by analyzing price charts. Resistance levels are often seen as horizontal lines where the price has struggled to break above multiple times in the past. These lines indicate areas where selling pressure has historically been strong. Traders can use similar tools and indicators as with support levels to identify and confirm resistance levels.

Key Differences between Support Resistance Levels:

  • Support levels are price points where buying interest is strong, while resistance levels are price points where selling interest is strong.

  • Support levels are below the current market price, indicating potential buying opportunities, whereas resistance levels are above the current market price, suggesting potential selling opportunities.

  • Support levels are formed as prices bounce back up from previous lows, while resistance levels are formed as prices reverse downwards from previous highs. 

Role of Support and Resistance in Options Trading

1. Support and Resistance as Crucial Indicators of Market Sentiment:

Support and resistance levels are like signposts that tell traders about the mood of the market. They show where buyers and sellers are likely to step in and affect the price of an asset. When prices approach support levels, it indicates that buyers are interested, and the market sentiment might be bullish. 

Conversely, when prices approach resistance levels, it suggests that sellers are active, and the market sentiment might be bearish. Understanding these levels helps traders gauge the overall sentiment of the market, which is crucial for making informed trading decisions.

2. Influence of Support Resistance Levels on Option Pricing:

Support and resistance levels can also have a significant impact on option pricing. When an asset reaches a support level, it often leads to increased buying interest, which can drive up the price of the asset and, consequently, the price of call options. 

Conversely, when an asset reaches a resistance level, it can lead to increased selling pressure, pushing down the price of the asset and the price of put options. Traders monitor support and resistance levels to anticipate changes in option pricing and adjust their strategies accordingly.

3. Utilizing Support and Resistance to Identify Potential Entry and Exit Points:

Support and resistance levels serve as valuable guideposts for identifying potential entry and exit points in options trading. Traders may look to enter bullish positions, such as buying call options, when prices bounce off support levels, indicating a potential uptrend. 

Similarly, traders may consider entering bearish positions, such as buying put options, when prices reverse from resistance levels, signaling a potential downtrend. These levels help traders pinpoint optimal entry and exit points, improving the timing of their trades and maximizing potential profits.

4. Role of Support and Resistance in Risk Management Strategies:

Support and resistance levels play a crucial role in risk management strategies for options trading. By placing stop-loss orders or setting profit targets near these levels, traders can effectively manage their risk exposure. For example, if a trader buys a call option and sets a stop-loss order just below a support level, it helps limit potential losses if the price breaks below that level. 

Similarly, setting profit targets near resistance levels can help lock in gains before the price reverses. Incorporating support and resistance levels into risk management strategies helps traders protect their capital and minimize losses.

5. Impact of Support and Resistance on Option Strategies Such as Covered Calls, Straddles, and Spreads:

Support and resistance levels influence various option strategies, including covered calls, straddles, and spreads. For example, in a covered call strategy, traders may choose to sell call options near resistance levels, where they believe the price is unlikely to exceed, generating income from premiums while potentially benefiting from a sideways or downward price movement. In a straddle strategy, traders may enter both call and put options near support and resistance levels, anticipating a significant price movement in either direction. 

Similarly, in spread strategies such as vertical spreads or iron condors, traders may adjust strike prices based on support and resistance levels to optimize risk-reward ratios. Understanding how support and resistance levels impact different option strategies allows traders to tailor their approaches to prevailing market conditions and increase the probability of success.

Strategies for Trading with Support and Resistance Levels

1. Bounce Trading Strategy:

Bounce trading is a strategy where traders buy options when the price of an asset approaches a support level and sell options when the price reaches a resistance level.

Buying near support levels: 

When the price of an asset approaches a support level, it tends to bounce back up as buyers step in. Traders look to buy call options or enter bullish positions at or near support levels, anticipating a price rebound.  

Selling near resistance levels: 

Conversely, when the price of an asset approaches a resistance level, it tends to reverse direction and move downwards. Traders look to sell call options or enter bearish positions at or near resistance levels, anticipating a price decline.

2. Breakout Trading Strategy:

Breakout trading is a strategy where traders trade options when the price breaks through either a support or a resistance level, indicating a potential trend continuation or reversal.

Trading options on breakout: 

When the price breaks through a support level, it may indicate a potential downtrend continuation, and traders may consider buying put options or entering bearish positions. Conversely, when the price breaks through a resistance level, it may signal a potential uptrend continuation, and traders may consider buying call options or entering bullish positions.

3. Trend Reversal Strategy:

Trend reversal strategy involves identifying options trading opportunities when support or resistance levels are breached, indicating a potential reversal in the prevailing market trend.

Identifying reversals: 

When the price breaks below a support level, it may signal a reversal from an uptrend to a downtrend, and traders may consider buying put options or entering bearish positions. Similarly, when the price breaks above a resistance level, it may signal a reversal from a downtrend to an uptrend, and traders may consider buying call options or entering bullish positions.

4. Combination Strategies:

Combination strategies involve integrating support and resistance levels with other technical indicators for enhanced trading decisions.

Using multiple indicators: 

Traders may combine support and resistance levels with other technical indicators such as moving averages, MACD, or RSI to confirm trading signals and improve the accuracy of their trades.  

Tailoring strategies: 

By integrating support and resistance levels with other indicators, traders can tailor their options trading strategies to different market conditions, increasing the probability of successful trades.

Tips for Effectively Using Support and Resistance Levels in Options Trading

1. Regularly Monitoring Support and Resistance Levels on Price Charts:

Regularly keeping an eye on support and resistance levels on price charts is crucial for options traders. This means checking them often to see if they hold up or if the price breaks through. 

By doing this, traders can stay updated on potential trading opportunities and market sentiment changes. It’s like keeping tabs on landmarks during a journey – they guide you and help you navigate through the market.

2. Verifying Support and Resistance Levels Across Multiple Timeframes:

Verifying support and resistance levels across different timeframes provides a more comprehensive view of market dynamics. Sometimes, what appears as a strong support or resistance level on one timeframe may not hold true on another. 

By checking across various timeframes, traders can confirm the significance of these levels and make more informed trading decisions. It’s akin to looking at a landscape from different angles to get a clearer picture.

3. Using Additional Technical Indicators to Confirm Support and Resistance Levels:

Incorporating additional technical indicators can help confirm the validity of support and resistance levels. Indicators like moving averages, trendlines, or volume analysis can provide supplementary evidence of market strength or weakness at these levels. 

This confirmation adds an extra layer of confidence to trading decisions and reduces the risk of false signals. It’s like double-checking your route with a GPS and a map to ensure you’re on the right track.

4. Adapting Trading Strategies Based on Evolving Support and Resistance Dynamics:

Support and resistance levels are not static – they can shift and evolve over time as market conditions change. Therefore, it’s essential for traders to adapt their trading strategies accordingly. This might involve adjusting entry and exit points, modifying risk management techniques, or even switching to different trading strategies altogether. 

Flexibility and adaptability are key to navigating the ever-changing landscape of support and resistance levels. It’s similar to adjusting your sailing route based on changing wind patterns to reach your destination smoothly.

Common Pitfalls to Avoid

1. Over-Reliance on Support and Resistance without Considering Other Market Factors:

One common mistake traders make is relying too much on support and resistance levels without taking into account other important market factors. Support and resistance levels are essential, but they’re not the only things that affect market movements. 

Traders should also consider factors like news events, economic indicators, and overall market sentiment. Focusing solely on support and resistance levels can lead to missed opportunities or misinterpretation of market trends.

2. Neglecting to Adjust Trading Strategies in Response to Changing Support and Resistance Levels:

Another pitfall is failing to adjust trading strategies when support and resistance levels change. Market conditions are dynamic, and support and resistance levels can shift over time. Traders who stick to the same strategy regardless of changing levels may find themselves entering trades at unfavorable prices or missing out on profitable opportunities. It’s important to adapt trading strategies to evolving market dynamics to stay ahead of the curve.

3. Failing to Incorporate Risk Management Techniques When Trading around Support and Resistance Levels:

Risk management is crucial in trading, yet some traders neglect to incorporate proper risk management techniques when trading around support and resistance levels. They may become overly optimistic when prices approach support levels or overly pessimistic when prices approach resistance levels, leading to excessive risk-taking or failure to cut losses. 

Implementing risk management techniques such as setting stop-loss orders, diversifying portfolios, and sizing positions appropriately helps protect capital and minimize losses, even when trading around support and resistance levels.

Support and resistance levels are like guiding lights in the world of options trading. They provide valuable insights into market sentiment, help identify potential entry and exit points, and influence option pricing. Support levels act as floors, preventing prices from falling further, while resistance levels act as ceilings, preventing prices from rising higher. By understanding and utilizing these levels effectively, traders can improve their trading decisions and increase their profitability in the options market.

For traders aiming to succeed in options trading, integrating support and resistance levels into their strategies is essential. These concepts serve as fundamental pillars that support trading decisions and risk management practices. By incorporating support and resistance analysis into their trading plans, traders can enhance their ability to identify high-probability trades, manage risk effectively, and maximize profits. Embracing these concepts can lead to more consistent and profitable trading outcomes over time.

In the dynamic options market, continuous learning and adaptation are key to staying ahead of the curve. Market conditions change, support and resistance levels shift, and new opportunities emerge regularly. Therefore, traders must remain open to learning, stay updated on market developments, and adapt their strategies accordingly. By continuously honing their skills, refining their approaches, and staying flexible in their trading methods, traders can navigate the complexities of the options market with confidence and achieve long-term success.

In essence, support and resistance levels are foundational concepts that play a crucial role in options trading. By recognizing their significance, integrating them into trading strategies, and embracing a mindset of continuous learning and adaptation, traders can unlock the full potential of these concepts and strive for profitability in the dynamic and ever-evolving options market. 

Leave a Comment