Buying and selling options, which are contracts that grant the holder the right but not the obligation to purchase or sell an underlying asset at a fixed price before or at the contract’s expiration date, is known as options trading. Although this kind of trading can be complicated, it presents chances for both profit and risk management.
In this blog post, we try to understand the fundamentals of options trading and show how a trader’s capacity to control risks and produce winning trades can be greatly increased by employing chart reading or analytical techniques.
Table of Contents
ToggleWhat is options trading?
Options trading involves buying and selling options contracts. These contracts are derived from underlying assets like stocks, indices, or commodities. There are two main types of options: calls and puts.
- Call Options: These give the buyer the right to purchase the underlying asset at a specific price (the strike price) within a certain period. Buyers of call options profit when the price of the underlying asset goes up.
- Put Options: These give the buyer the right to sell the underlying asset at a specific price within a certain period. Buyers of put options profit when the price of the underlying asset goes down.
When you buy an option, you pay a premium, which is the price of the option. This premium is a cost that you bear whether or not you exercise the option.
Options can be used for various purposes:
Hedging: Protecting your investments from losses.
Speculation: Betting on the direction of the market to make a profit.
Income generation: Earning premiums by selling options.
What is the Importance of Chart Analysis in Options Trading?
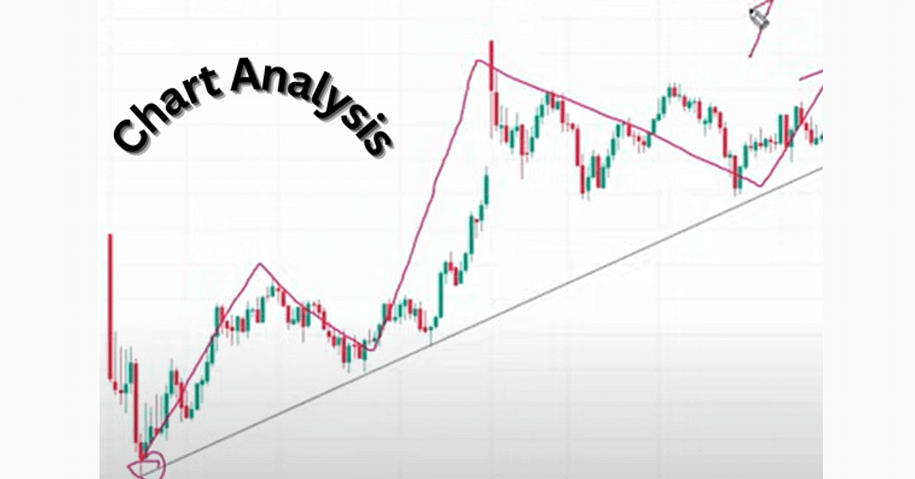
Chart analysis, also known as technical analysis or chart reading, plays a crucial role in options trading. It involves studying price charts and using price action or various indicators to predict future price movements of the underlying asset. Here’s why it is important:
- Identifying Trends: Chart analysis helps traders spot trends in the market. Knowing whether the market is in an uptrend, downtrend, or sideways trend can help traders make informed decisions about buying or selling options.
- Timing Trades: Chart analysis helps traders determine the best times to enter or exit a trade. This is particularly important in options trading where timing can significantly affect profitability due to the time-sensitive nature of options.
- Risk Management: Using the chart, traders can set stop-loss orders and identify potential support and resistance levels. This helps in managing risk and protecting investments from significant losses.
- Understanding Market Sentiment: Chart patterns and indicators reflect the psychological state of the market participants. Recognizing patterns like head and shoulders, double tops, or moving average crossovers can give insights into market sentiment and potential future movements.
Understanding the Basics of Charts
Charts are visual tools used to represent data. They help in identifying patterns and trends, making it easier to analyze information quickly.
Types of Charts
1. Line Charts
What they are: Line charts use points connected by lines to show how values change over time.
Use: Ideal for showing trends over periods (e.g., stock prices, temperature changes).
Example: A line chart showing the stock price of a company over a year.
2. Bar Charts
What they are: Bar charts use rectangular bars to represent different values. The height or length of the bar indicates the value.
Use: Great for comparing different categories or values (e.g., sales of different products).
Example: A bar chart comparing the quarterly sales of various products.
3. Candlestick Charts
What they are: Candlestick charts display the high, low, opening, and closing prices of a stock or index for a specific period. Each “candlestick” represents one time period (e.g., One day, Week, Hour).
Use: Mostly used in stock market analysis to identify price patterns and trends.
Example: A candlestick chart showing daily price movements of a stock.
Key Components of Chart
1. Timeframes
What they are: The period over which data is displayed on the chart.
Types:
Daily: Shows data for each day.
Weekly: Aggregates data by week.
Monthly: Aggregates data by month.
Use: Different timeframes help traders and investors analyze short-term or long-term trends.
2. Price Scales
Linear vs. Logarithmic:
Linear Scale: The vertical axis increases by equal intervals (e.g., $10, $20, $30). It shows absolute changes.
Logarithmic Scale: The vertical axis increases by percentage (e.g., 10%, 20%, 30%). It shows relative changes.
Use:
- Linear scales are useful for short-term analysis or when price changes are small.
- Logarithmic scales are better for long-term analysis, especially when prices change dramatically.
Essential Chart Patterns for Options Trading
Understanding chart patterns helps traders predict future price movements, which is crucial for options trading.
Trend Patterns
1. Uptrends, Downtrends, and Sideways Trends
Uptrend: Prices consistently rise, forming higher highs and higher lows. Indicates a strong market.
Downtrend: Prices consistently fall, forming lower highs and lower lows. Indicates a weak market.
Sideways Trend: Prices move within a range without a clear upward or downward direction. Indicates indecision in the market.
2. Identifying Support and Resistance Levels
Support Level: A price point where a stock tends to stop falling and may bounce back up. Acts as a “floor.”
Resistance Level: A price point where a stock tends to stop rising and may fall back down. Acts as a “ceiling.”
Reversal Patterns
1. Head and Shoulders
Pattern: Consists of three peaks:
- Left shoulder (a peak followed by a dip)
- Head (a higher peak followed by a dip)
- Right shoulder (a peak similar to the left shoulder)
Indicates: A potential reversal from an uptrend to a downtrend.
2. Double Tops and Bottoms
Double Top: Two peaks at about the same level, indicating a reversal from an uptrend to a downtrend.
Double Bottom: Two valleys at about the same level, indicating a reversal from a downtrend to an uptrend.
Continuation Patterns
1. Flags and Pennants
Flags: Small rectangular patterns that slope against the prevailing trend, resembling a flag on a pole.
Indicates: A brief consolidation before the trend continues.
Pennants: Small symmetrical triangles that form after a sharp move, indicating a pause before continuing in the same direction.
2. Triangles
Ascending Triangle: Formed by a rising support line and a horizontal resistance line. Indicates potential upward breakout.
Descending Triangle: Formed by a falling resistance line and a horizontal support line. Indicates a potential downward breakout.
Symmetrical Triangle: Formed by converging support and resistance lines. Indicates a potential breakout in either direction.
Advanced Charting Techniques
These techniques help traders analyze price movements more effectively and make informed decisions.
Fibonacci Retracements
Understanding Fibonacci Levels
What they are: Fibonacci levels are based on the Fibonacci sequence, a series of numbers where each number is the sum of the two preceding ones (e.g., 0, 1, 1, 2, 3, 5, 8…).
Key Levels: Common levels used in trading include 23.6%, 38.2%, 50%, 61.8%, and 100%.
Applying Fibonacci Retracements in Chart Analysis
Purpose: Used to identify potential support and resistance levels where the price may reverse.
How to Use:
- Identify a significant price movement (upward or downward).
- Draw the Fibonacci retracement levels from the start to the end of the move.
- Look for price reactions at these levels for potential entry or exit points.
Bollinger Bands
Concept of Bollinger Bands
What they are: Bollinger Bands consist of three lines:
- A middle band (simple moving average)
- An upper band (above the middle band)
- A lower band (below the middle band)
Purpose: Measure volatility (how much the price fluctuates).
Using Bollinger Bands for Volatility Analysis
How to Use:
- When bands widen, volatility is high.
- When bands narrow, volatility is low.
- Price touching the upper band may indicate overbought conditions.
- Price touching the lower band may indicate oversold conditions.
Ichimoku Cloud
Components of the Ichimoku Cloud
Components:
Tenkansen (Conversion Line): Shortterm average
Kijunsen (Base Line): Mediumterm average
Senkou Span A and B (Leading Span A and B): Form the cloud (Kumo)
Chikou Span (Lagging Span): Closing price plotted behind the current price
Cloud (Kumo): Represents support and resistance, trend direction, and momentum.
Interpreting Signals from the Ichimoku Cloud
How to Use:
Price above the cloud: Bullish trend.
Price below the cloud: Bearish trend.
Price within the cloud: Consolidation or uncertainty.
Bullish Signal: Tenkansen crosses above Kijunsen.
Bearish Signal: Tenkansen crosses below Kijunsen.
Practical steps for chart analysis in options trading
1. Setting Up Your Charting Platform
a. Choose a Charting Platform
Select a platform like TradingView, ThinkorSwim, or any broker-provided platform that you find user-friendly.
b. Customize Your Layout
Adjust the layout to display candlestick charts as they provide detailed price information.
Include necessary tools like drawing tools and technical indicators.
c. Set Up Alerts
Configure alerts for price levels or indicators that signal potential trading opportunities.
2. Choosing the Right Time Frame for Your Trading Style
a. Understand Different Time Frames
Intraday Trading: Use 1-minute to 15-minute charts.
Swing Trading: Use 1 hour to daily charts.
Long-term Trading: Use daily to weekly charts.
b. Match Time Frame with Strategy
Shorter time frames are suitable for quick trades; longer time frames are better for holding positions over days or weeks.
3. Combining Chart Patterns and Technical Indicators
a. Identify Chart Patterns
Look for patterns like head and shoulders, double tops/bottoms, and flags. These patterns help predict future price movements.
b. Use Technical Indicators
Moving Averages: Show the average price over a period and can indicate trend direction.
Relative Strength Index (RSI): Measures momentum and indicates overbought or oversold conditions.
MACD (Moving Average Convergence Divergence): Helps identify trend changes and momentum.
c. Combine Patterns and Indicators
Use patterns to identify potential entry and exit points, and confirm these with indicators. For example, if you see a bullish pattern, check if the RSI indicates the stock is not overbought.
4. Making Trading Decisions Based on Chart Analysis
a. Entry Points
Identify potential entry points where the chart patterns and indicators suggest a strong likelihood of price movement in your favor.
b. Set StopLoss and TakeProfit Levels
StopLoss: Place a stoploss order to limit potential losses if the trade goes against you.
TakeProfit: Set a target price to secure profits when the stock reaches your desired level.
c. Monitor Trades
Keep an eye on open positions and adjust stop loss or take profit levels as needed based on market conditions.
d. Review and Adjust Strategy
After trades are closed, review the outcomes and adjust your strategy based on what worked and what didn’t.
Tools and resources for chart analysis
1. Charting Software and Platforms
Popular Charting Platforms
a. TradingView
Description: TradingView is a widely used, user-friendly platform with a large community.
Features: Offers various chart types, technical indicators, drawing tools, and a social network for traders to share ideas.
b. ThinkorSwim
Description: Provided by TD Ameritrade, known for its advanced features.
Features: Includes customizable charts, a wide range of technical indicators, and options-specific tools.
c. MetaTrader
Description: Popular for forex and stock trading.
Features: Offers automated trading capabilities, advanced charting, and a range of indicators.
d. eToro
Description: A social trading platform that includes charting tools.
Features: Social trading features allow you to follow and copy successful traders.
Features to Look for in a Charting Platform
a. User Interface
Ensure it is intuitive and easy to navigate.
b. Chart Types
Availability of different chart types (e.g., candlestick, line, bar).
c. Technical Indicators
A wide variety of indicators (e.g., moving averages, RSI, MACD).
d. Drawing Tools
Tools for trend lines, support/resistance levels, and annotations.
e. Customization
Ability to customize charts and indicators to fit your trading style.
f. Alerts and Notifications
Set alerts for specific price levels or indicator conditions.
g. Data Feeds
Real-time data and historical data availability.
2. Educational Resources
Books
- “Technical Analysis of the Financial Markets” by John J. Murphy
Covers the basics of technical analysis, chart patterns, and indicators.
- “A Beginner’s Guide to Day Trading Online” by Toni Turner
Offers insights into day trading strategies and market psychology.
- “Japanese Candlestick Charting Techniques” by Steve Nison
Focuses on candlestick patterns and their interpretations.
Courses
a. Online Platforms (e.g., Udemy, Coursera, Options Trading Only)
Offer courses on technical analysis, options trading, and charting strategies.
b. Investopedia Academy
Provides courses on various trading topics, including chart analysis and options trading.
c. Brokers’ Educational Resources
Many brokers, like TD Ameritrade, offer free educational materials and webinars.
Online Communities
a. Reddit (e.g., r/StockMarket, r/Options, r/Optionstradingwisdom)
Discussion forums where traders share strategies, insights, and experiences.
b. TradingView Community
Engage with other traders, share ideas, and learn from shared analysis.
c. Twitter
Follow traders and analysts for market updates and chart analysis tips.
Recommendations for Further Learning
1. Join Trading Groups or Forums
Engage with communities to ask questions and share insights.
2. Practice with Demo Accounts
Use demo accounts to practice chart analysis without risking real money.
3. Attend Webinars and Workshops
Participate in live sessions to learn from experts and ask questions in real-time.
4. Follow Financial News
Stay updated on market trends and news that can impact your trading.
Conclusion
Chart analysis is crucial for making informed trading decisions. It helps identify trends, patterns, and potential entry and exit points, which are essential for successful options trading. Continuous practice and learning are vital.
As you become more familiar with chart patterns and technical indicators, your ability to analyze and predict market movements will improve. Begin integrating chart analysis into your trading routine. Use the tools and resources discussed to practice and refine your strategies.
Engage with trading communities and share your experiences. Ask questions, seek advice, and learn from others. This collaborative approach will enhance your skills and confidence.
By embracing chart analysis and staying committed to learning, you’ll be well-equipped to navigate the complexities of options trading. Happy trading!


