Did you know many top traders use price action trading to make decisions? It’s popular because it works well! All set ups are depend on price action even indicators also follow price action, so from traders point of view price action is most important, and they have to follow price action first for better results.
Price action trading is a method where traders make decisions based on the price movements on charts, without relying on indicators or other tools.
In this post, we’ll explore five main types of price action trading: Support and Resistance, Chart Patterns, Candlestick Patterns, Trend Lines, and Fibonacci Retracements.
Table of Contents
Toggle1: Support and Resistance
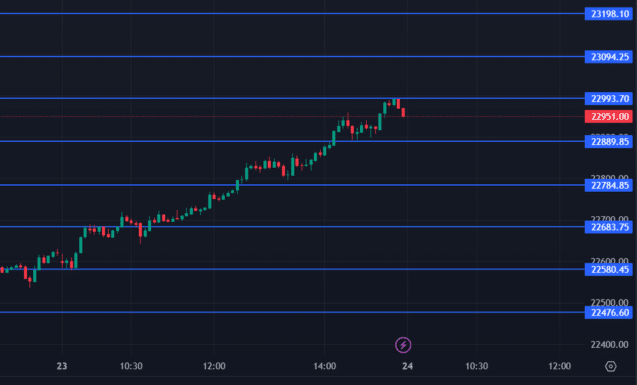
Support and resistance levels are key concepts in price action trading. They refer to specific price levels on a chart that tend to act as barriers to price movement.

Support:
This is a price level where a falling price tends to stop and reverse direction. Think of it as a floor that supports the price and prevents it from going lower. This happens because there is a lot of demand or buying interest at that level.
Resistance:
This is a price level where a rising price tends to stop and reverse direction. Imagine it as a ceiling that resists the price from going higher. This occurs because there is a lot of supply or selling interest at that level.
Identification:
Historical Price Data:
By looking at past price movements on a chart, you can spot areas where the price has consistently stopped and reversed. These areas are potential support and resistance levels. For example, if a stock has repeatedly bounced back up after hitting 50 Rs, that level could be seen as support.
Technical Indicators:
Tools like moving averages can help identify support and resistance levels. A moving average smooths out price data to create a single flowing line.
This line can act as a dynamic support or resistance level. For instance, if a stock tends to bounce off its 50-day moving average, that average can be considered a support level.
Trading Strategies:
Bounce Trading:
This strategy involves buying a stock when it hits a support level and selling it when it reaches a resistance level. The idea is to profit from the price bouncing between these levels.
For example, if a stock hits its support level at 100 Rs, you buy it and then sell it when it reaches its resistance level at 120 Rs.
Breakout Trading:
This strategy is based on the price breaking through support or resistance levels. If the price breaks above a resistance level, it might keep rising, so you buy.
If it breaks below a support level, it might keep falling, so you sell or short. For example, if a stock breaks above its resistance level at 120 Rs, you buy it expecting it to rise further.
Pros and Cons:
Pros:
Simplicity:
Support and resistance levels are easy to understand and identify, even for beginners. Any one can draw perfect support and resistance levels with little understanding of chart.
Wide Application:
These levels can be used in any market, whether it’s stocks, forex, or commodities. Where is the chart, there is the support resistance.
Cons:
Subjectivity:
Determining exact support and resistance levels can sometimes be subjective, as different traders might see different levels on the same chart.
False Breakouts:
Sometimes the price may appear to break through a support or resistance level, only to reverse direction. These false breakouts can lead to losses if not managed properly.
2: Chart Patterns
Chart patterns are shapes and formations created by price movements on a chart. These patterns are significant in price action trading because they can help traders predict future price movements based on past behavior.
Common Patterns:
1. Head and Shoulders:
Description:
This pattern indicates a reversal in the current trend. It consists of three peaks: a higher peak (head) between two lower peaks (shoulders).
Formation:
First, the price rises to form the left shoulder, then dips. It rises again to a higher peak (head) and then dips again. Finally, it rises to form the right shoulder but not as high as the head and then falls again.
Significance:
When the price drops below the level of the two shoulders (neckline), it signals a potential downward trend reversal.
2. Double Tops and Bottoms:
Description:
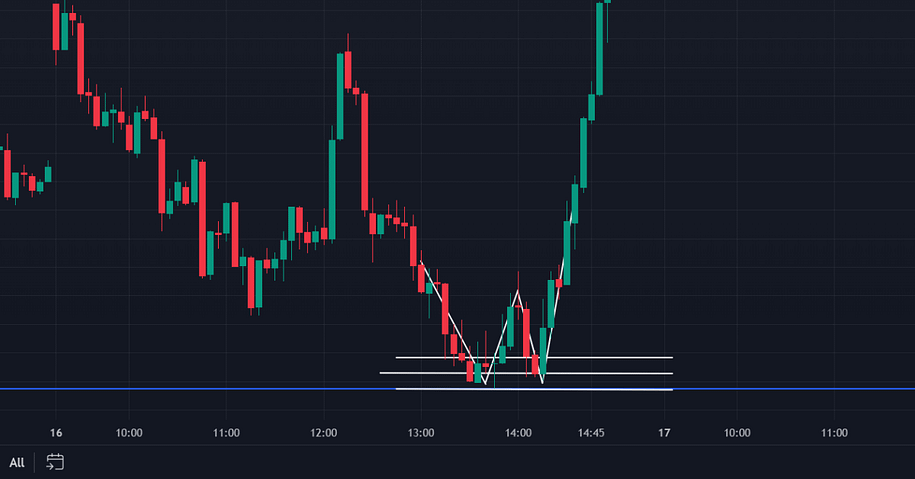
These patterns also indicate potential trend reversals in price action trading. A double top looks like an ‘M’, while a double bottom looks like a ‘W’.
Formation:
For a double top, the price rises to a peak, falls back, rises again to a similar peak, and then falls again. For a double bottom, the price falls to a low, rises, falls to a similar low, and then rises again. Many traders say this is a second chance of entry.
Significance:
A double top signals a potential downward reversal, while a double bottom signals a potential upward reversal.
3. Triangles:
Description:
Triangles show periods of consolidation before the price breaks out in one direction.
Types:
Ascending Triangle:
Formed by a flat top and an upward-sloping bottom.
Descending Triangle:
Formed by a flat bottom and a downward-sloping top.
Symmetrical Triangle:
Formed by converging upward-sloping and downward-sloping lines.
Significance:
These patterns indicate that a breakout (a significant price movement) is likely to occur once the price moves out of the triangle.
Identification:
Formation: To spot these patterns:
Look for the specific shapes (head and shoulders, ‘M’ or ‘W’ shapes for double tops/bottoms, and triangle formations).
Pay attention to the peaks and troughs that form these shapes.
Volume:
Trading volume can confirm patterns. For example, in a head and shoulders pattern, the volume often decreases during the formation of the pattern and increases when the price breaks the neckline.
Trading Strategies:
Entry Points:
- For head and shoulders, enter a sell position when the price breaks below the neckline.
- For double tops, enter a sell position when the price falls below the lowest point between the two peaks.
- For double bottoms, enter a buy position when the price rises above the highest point between the two troughs.
- For triangles, enter a trade when the price breaks out of the triangle pattern.
Targets:
Measure the height of the pattern (distance from the highest peak to the neckline for head and shoulders, or the distance between peaks and troughs for double tops/bottoms) and project this distance from the breakout point to set profit targets.
Stop Loss:
Place stop loss orders just above the last peak for sell positions or just below the last trough for buy positions to manage risk.
Pros and Cons:
Pros:
Clear Entry and Exit Points:
These patterns provide clear signals on when to enter or exit trades.
Predicting Market Movements:
They help in anticipating future price movements based on historical patterns.
Cons:
Requires Experience:
Identifying patterns accurately takes practice and experience.
False Signals:
Patterns can sometimes give false signals, leading to potential losses. It’s essential to confirm patterns with other indicators and analysis.
To learn price action trading in-depth, visit: Option Trading Only.
3: Candlestick Patterns
Candlestick patterns are visual representations of price movements in a specific time period, showing the opening, closing, high, and low prices in price action trading. These patterns originated in Japan over 100 years ago and were used by rice traders to predict future price movements.
Components:
Body:
The thick part of the candlestick shows the opening and closing prices. If the closing price is higher than the opening price, the body is usually green or white (bullish). If the closing price is lower than the opening price, the body is usually red or black (bearish).
Wick/Shadow:
The thin lines above and below the body show the highest and lowest prices during the period.
Basic Patterns:
1. Single Candlestick Patterns:
Doji:
The opening and closing prices are almost the same, creating a very small body. It indicates indecision in the market.
Hammer:
Has a small body at the top with a long lower wick. It suggests a potential reversal from a downtrend to an uptrend.
Shooting Star:
Has a small body at the bottom with a long upper wick. It suggests a potential reversal from an uptrend to a downtrend.
2. Multiple Candlestick Patterns:
Engulfing Patterns:
Bullish Engulfing:
A small bearish candlestick is followed by a large bullish candlestick that completely engulfs the previous one. Indicates a potential upward reversal.
Bearish Engulfing:
A small bullish candlestick is followed by a large bearish candlestick that completely engulfs the previous one. Indicates a potential downward reversal.
Morning Star:
A three candlestick pattern. The first is a large bearish candlestick, the second is a small bodied candlestick (bullish or bearish), and the third is a large bullish candlestick. It signals a potential upward reversal.
Evening Star:
The opposite of the Morning Star. It signals a potential downward reversal.
Identification:
Bullish Patterns:
Look for patterns like the Hammer, Bullish Engulfing, and Morning Star which indicate potential price increases.
Bearish Patterns:
Look for patterns like the Shooting Star, Bearish Engulfing, and Evening Star which indicate potential price decreases.
Trading Strategies:
Reversal Patterns:
Use patterns like the Hammer or Morning Star to identify when a trend might reverse in price action trading. For example, if you see a Hammer after a downtrend, it might be a good time to buy.
Continuation Patterns:
Use patterns like Doji or Engulfing patterns to confirm that the current trend will continue in price action trading. For example, if you see a Bullish Engulfing pattern during an uptrend, it might be a good sign to hold onto your position.
Pros and Cons:
Pros:
Detailed Insights:
Candlestick patterns provide detailed information about market sentiment in a single glance.
Easy to Identify:
With a bit of practice, these patterns become easy to spot on a chart.
Cons:
Confirmation Needed:
These patterns often require confirmation from other indicators to be reliable.
Low Volume Markets:
In markets with low trading volume, candlestick patterns can be misleading because the price movements may not be as significant.
By understanding and recognizing these candlestick patterns, traders can make more informed decisions and potentially increase their chances of successful trades.
4: Trend Lines
Trend lines are straight lines drawn on a chart that connect specific price points, helping to visualize the direction and strength of a trend. They are important in technical analysis because they help traders identify and follow trends in price action trading.
Types of Trends:
Uptrends:
Characterized by prices making higher highs and higher lows. Indicates a bullish market where prices are generally rising.
Downtrends:
Characterized by prices making lower highs and lower lows. This indicates a bearish market where prices are generally falling.
Sideways Trends:
Prices move horizontally, making relatively equal highs and lows. Indicates a market with no clear direction.
Identification:
Drawing Effective Trend Lines:
Uptrend Lines:
Connect the higher lows (the lowest points before the price rises again) to draw a line that slopes upwards. This line acts as a support level during the uptrend.
Downtrend Lines:
Connect the lower highs (the highest points before the price falls again) to draw a line that slopes downwards. This line acts as a resistance level during the downtrend.
Trading Strategies:
Using Trend Lines for Entries and Exits:
Within the Trend:
Buy during an uptrend when the price touches the uptrend line (support) and sell during a downtrend when the price touches the downtrend line (resistance).
At Breakouts:
Enter a trade when the price breaks through a trend line, indicating a potential change in trend. For example, if the price breaks above a downtrend line, it might signal a new uptrend.
Channel Trading:
Identification:
Identify parallel trend lines to form a price channel. Draw one line connecting the higher lows (support) and another parallel line connecting the higher highs (resistance) in an uptrend, or the lower highs (resistance) and lower lows (support) in a downtrend.
Strategy:
Buy at the lower trend line (support) and sell at the upper trend line (resistance) within the channel.
Pros and Cons:
Pros:
Identifying Direction and Strength:
Trend lines help traders see the direction and strength of a trend, making it easier to make trading decisions.
Easy to Draw:
With some practice, drawing trend lines becomes straightforward and quick.
Cons:
Subjective:
Different traders might draw trend lines slightly differently, leading to varied interpretations.
Frequent Adjustments:
As new price data comes in, trend lines may need to be adjusted frequently to remain accurate.
By using trend lines, traders can better understand the overall direction of the market and make more informed trading decisions based on the observed trends.
Read More: Simple 21 Options Day Trading Rules To Become a Profitable Trader
5: Fibonacci Retracements
Fibonacci retracement levels are horizontal lines on a chart that indicate potential support and resistance levels. These levels are based on the Fibonacci sequence, a series of numbers where each number is the sum of the two preceding ones (e.g., 0, 1, 1, 2, 3, 5, 8, 13, etc.).
The key Fibonacci retracement levels (23.6%, 38.2%, 50%, 61.8%, 78.6%) are derived from mathematical ratios found in this sequence.
Key Levels:
- 23.6%: A minor retracement level.
- 38.2%: Often used to identify the beginning of a retracement.
- 50%: A common level, though not an official Fibonacci ratio, indicating a potential halfway point of a retracement.
- 61.8%: A major retracement level, often signaling strong support or resistance.
- 78.6%: A deep retracement level, indicating a significant reversal possibility.
Identification:
Applying Fibonacci Retracement Levels:
Swing Highs and Lows:
First, identify the significant high (peak) and low (trough) points on a price chart.
Drawing the Levels:
Use a Fibonacci retracement tool (available on most charting platforms) to draw a line from the swing low to the swing high in an uptrend, or from the swing high to the swing low in a downtrend. The tool will automatically generate the Fibonacci levels.
Trading Strategies:
Retracement Entries:
During a pullback in an uptrend, look for entry points at Fibonacci retracement levels (e.g., 38.2%, 50%, 61.8%). For instance, if a stock price pulls back to the 38.2% level after a rise, it may be a good point to buy, anticipating the price will resume its upward movement.
Extension Levels:
Once the retracement is complete and the price resumes its trend, use Fibonacci extension levels to set profit targets. Extension levels go beyond 100% and are used to predict where the price might go. Common extension levels are 161.8%, 261.8%, etc.
Pros and Cons:
Pros:
Specific Levels:
Fibonacci retracements provide specific levels where price reversals might occur, helping traders make more precise decisions.
Combines Well with Other Methods:
These levels can be used alongside other analysis methods, such as trend lines or moving averages, for stronger confirmation. Cons:
Not Always Accurate:
Price may not always reverse at Fibonacci levels, leading to potential losses.
Requires Precision:
Accurate identification of swing high and low points is crucial. Misidentifying these points can lead to incorrect levels and poor trading decisions.
By understanding and effectively using Fibonacci retracement levels, traders can identify potential entry and exit points, manage risk, and improve their trading outcomes.
Conclusion
In this blog post, we explored five major types of price action trading:
- Support and Resistance: Key levels where the price tends to stop and reverse.
- Chart Patterns: Shapes on a chart that predict future price movements, such as Head and Shoulders, Double Tops/Bottoms, and Triangles.
- Candlestick Patterns: Visual representations of price movements that indicate market sentiment, including patterns like Doji, Hammer, and Engulfing Patterns.
- Trend Lines: Lines that help identify the direction and strength of a trend by connecting highs or lows.
- Fibonacci Retracements: Levels based on the Fibonacci sequence that indicate potential support and resistance during pullbacks.
Effectively using these price action trading methods requires practice and experience. It’s important to spend time studying charts, recognizing patterns, and understanding how price moves in different market conditions. The more you practice, the better you’ll get at identifying and using these techniques in your trading.
Combining different price action trading techniques can lead to better results. For example, using support and resistance levels along with candlestick patterns can provide stronger signals.
Always remember to incorporate risk management strategies, such as setting stoploss orders and managing your position size, to protect your capital. Trading involves risks, but with careful analysis and disciplined strategies, you can improve your chances of success. Keep learning, stay patient, and happy trading!


